There are many ways to look at the relationship between two categorical variables.
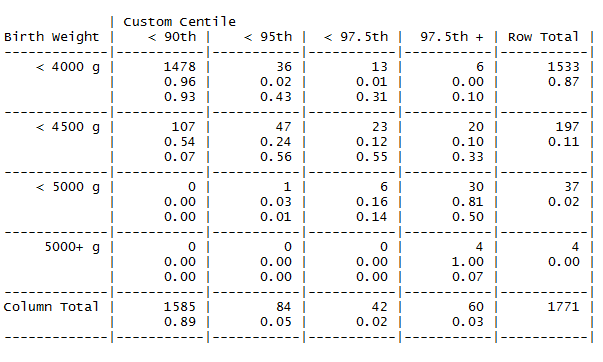
A simple contingency table will often do the job.
library(gmodels)

macroTable <- (data$macro, data$macroCust,
               dnn = c("Birth Weight", "Customised Centile")

CrossTable(macroTable, digits = 2, prop.t = F, prop.chisq = F)
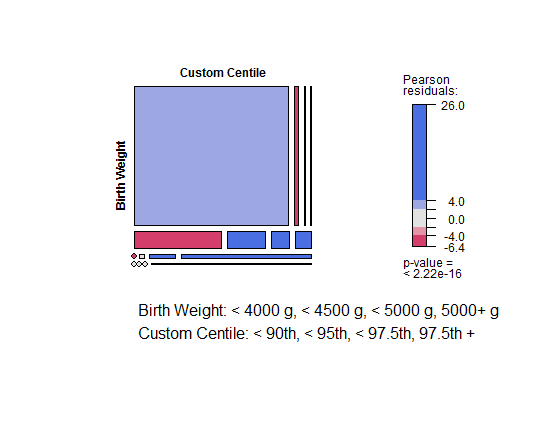
Mosaic plots are pretty cool.
library(vcd)

mosaic(macroTable,
       labeling = labeling_list(sep = ", ", cols = 1),
       margins  = c(bottom = 7),
       legend   = T,
       shade    = T)
However, something I’ve really come to appreciate is the river plot. For example:
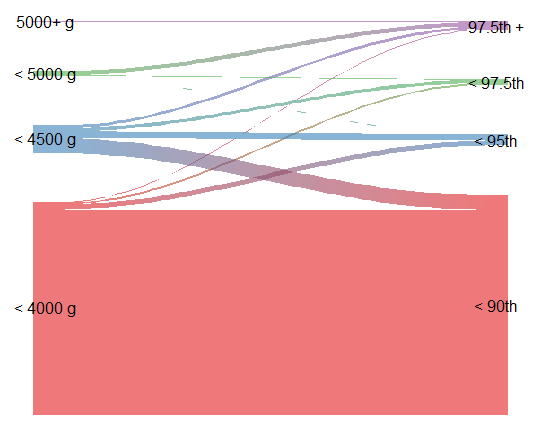
You can make these using the R library(riverplot), but you have to do a bit of data wrangling first. I have written a function to help with this when I am working from a data frame where the two factor variables are in separate columns, and the rows are observations.
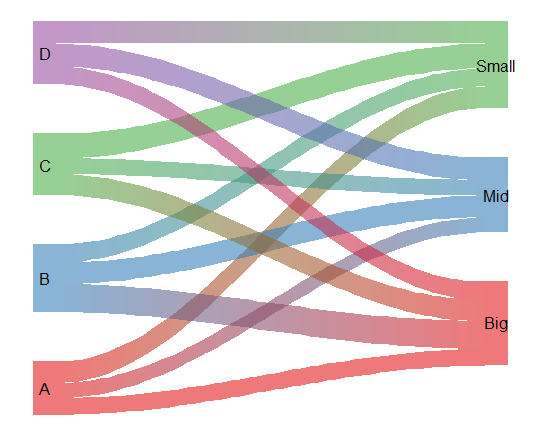
data <- data.frame("ID" = c(1:500),
                   "A"  = factor(sample(c(1:4), 500, replace = T),
                                 labels = c("A", "B", "C", "D")),
                   "B"  = factor(sample(c(1:3), 500, replace = T),
                                 labels = c("Big", "Mid", "Small")))

makeRivPlot(data, "A", "B")
Here is the function.
makeRivPlot <- function(data, var1, var2) {

  require(dplyr)          # Needed for the count function
  require(riverplot)      # Does all the real work
  require(RColorBrewer)   # To assign nice colours

  names1 <- levels(data[, var1])
  names2 <- levels(data[, var2])

  var1   <- as.numeric(data[, var1])
  var2   <- as.numeric(data[, var2])

  edges  <- data.frame(var1, var2 + max(var1, na.rm = T))
  edges  <- count(edges)

  colnames(edges) <- c("N1", "N2", "Value")

  nodes <- data.frame(
           ID     = c(1:(max(var1, na.rm = T) +
                         max(var2, na.rm = T))),
           x      =  c(rep(1, times = max(var1, na.rm = T)),
                       rep(2, times = max(var2, na.rm = T))),
           labels = c(names1, names2) ,
           col    = c(brewer.pal(max(var1, na.rm = T), "Set1"),
                      brewer.pal(max(var2, na.rm = T), "Set1")),
           stringsAsFactors = FALSE)

  nodes$col <- paste(nodes$col, 95, sep = "")

  river <- makeRiver(nodes, edges)

  return(plot(river))
}
Related Links: